 View Slides
5 ways to avoid data model issues in Power BI
Essential design practices and visual guidelines to prevent performance bottlenecks, relationship ambiguities, and data modeling pitfalls in Power BI.
Visual slide decks, educational carousels, and downloadable guides covering Python, Data Analytics, Power BI, SQL, Machine Learning, Deep Learning, and Generative AI.
View Slides
Essential design practices and visual guidelines to prevent performance bottlenecks, relationship ambiguities, and data modeling pitfalls in Power BI.
 View Slides
Explain the difference between WHERE and HAVING. What are the different types of SQL JOINs?
 View Slides
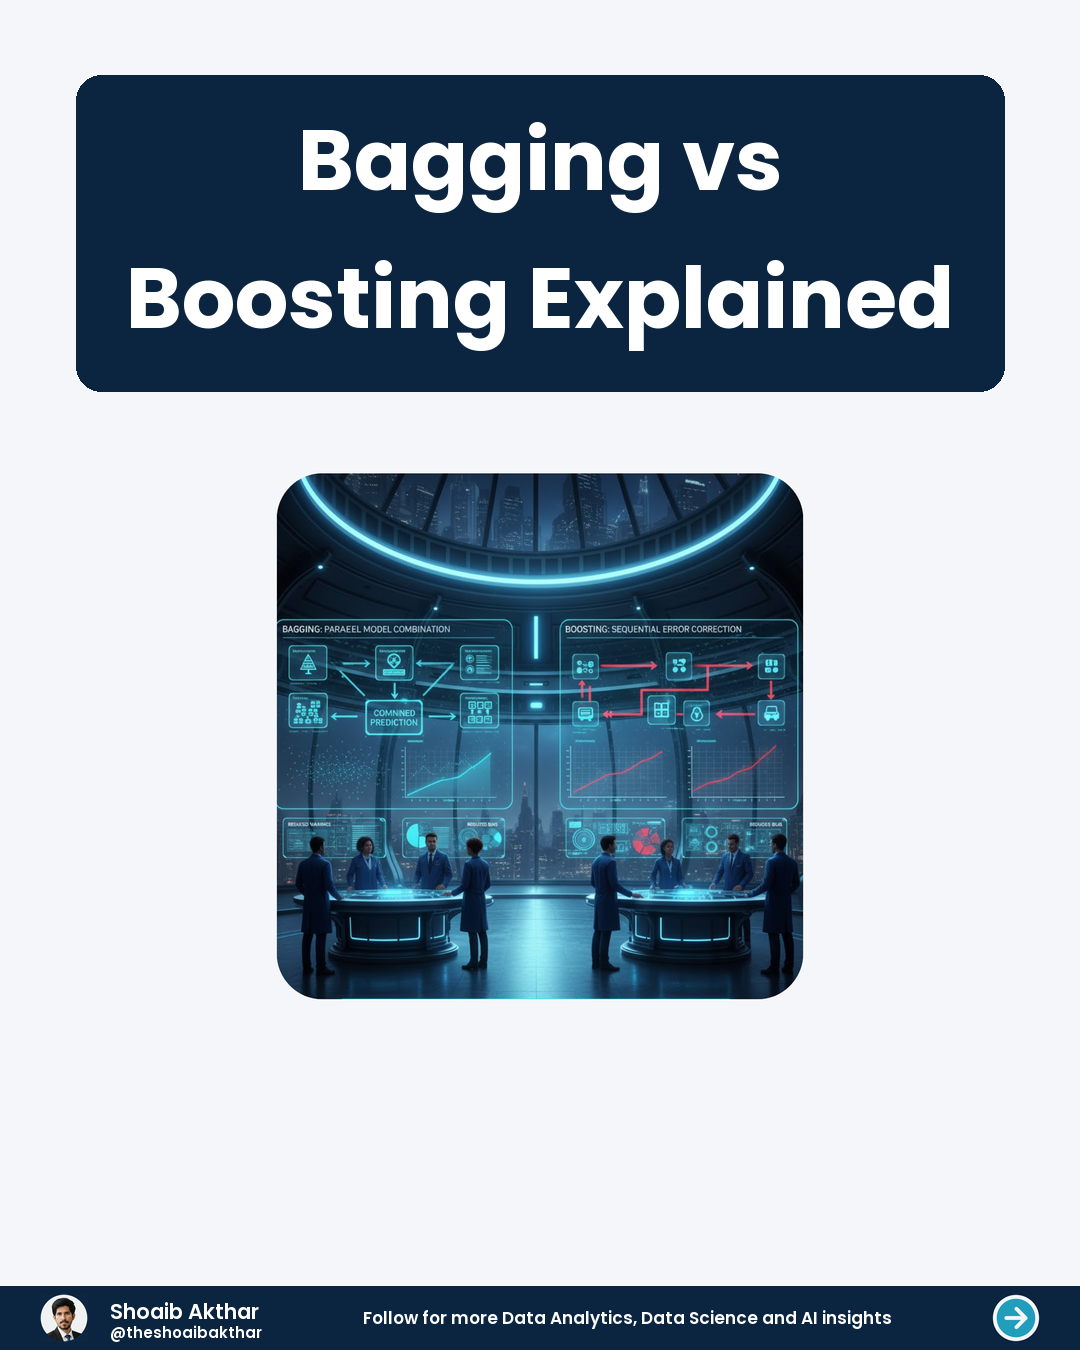
Bagging stands for Bootstrap Aggregating It combines multiple models to reduce variance
 View Slides
A single train/test split introduces bias. Your model performs best on the data it sees.
 View Slides
The foundation of everything we will discuss. It is the art and science of extracting insights from data.
 View Slides
Bias is the error from overly simplistic assumptions in your model. A high-bias model fails to capture the underlying trends in the data.
 View Slides
Gathering the right data is the foundation of any successful machine learning project. This involves identifying relevant data sources, cleaning messy information, and ensuring data quality. Think of it as preparing ingredients for a recipe – good ingredients lead to a great result. The more comprehensive and reliable your data, the better your model will perform. Data cleaning processes are crucial. This includes handling missing values, removing duplicates, and correcting errors. Data transformation also plays a role, reshaping the data into a format suitable for your chosen machine learning algorithm. Careful data preparation significantly improves model accuracy and reduces bias.
 View Slides
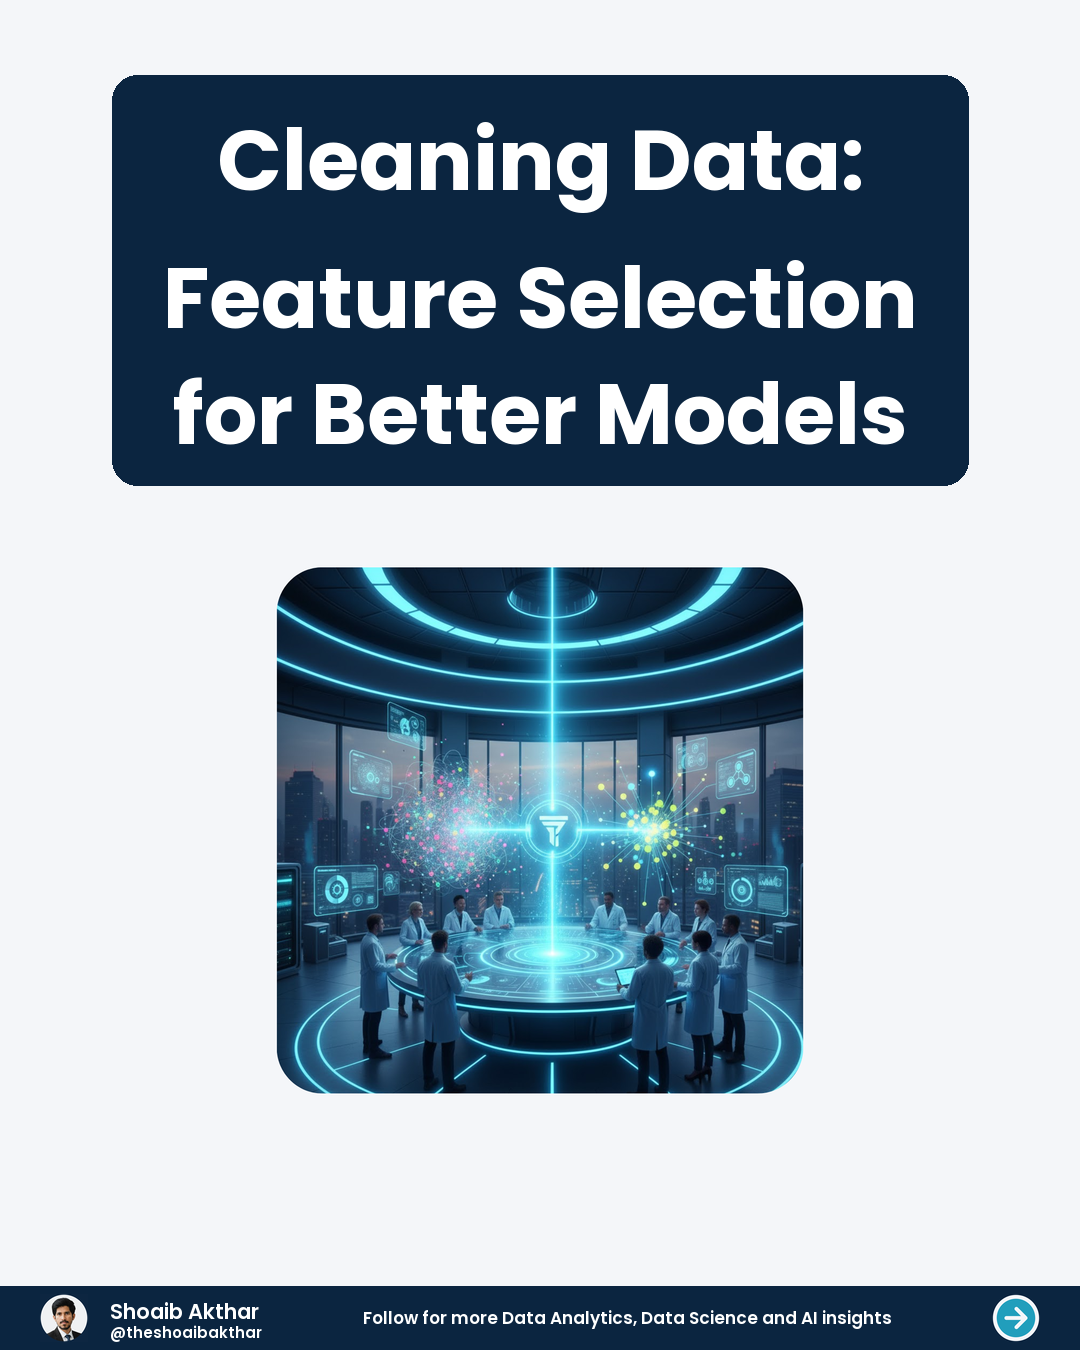
What is Feature Selection? Feature selection is a crucial step in machine learning. It involves choosing the most relevant features from your dataset, discarding irrelevant or redundant ones. This simplifies the model, improves performance, and reduces training time. It's like decluttering your toolbox to focus on the essentials for a job.
 View Slides
Keys are special fields in a database table. They help to uniquely identify each record.
 View Slides
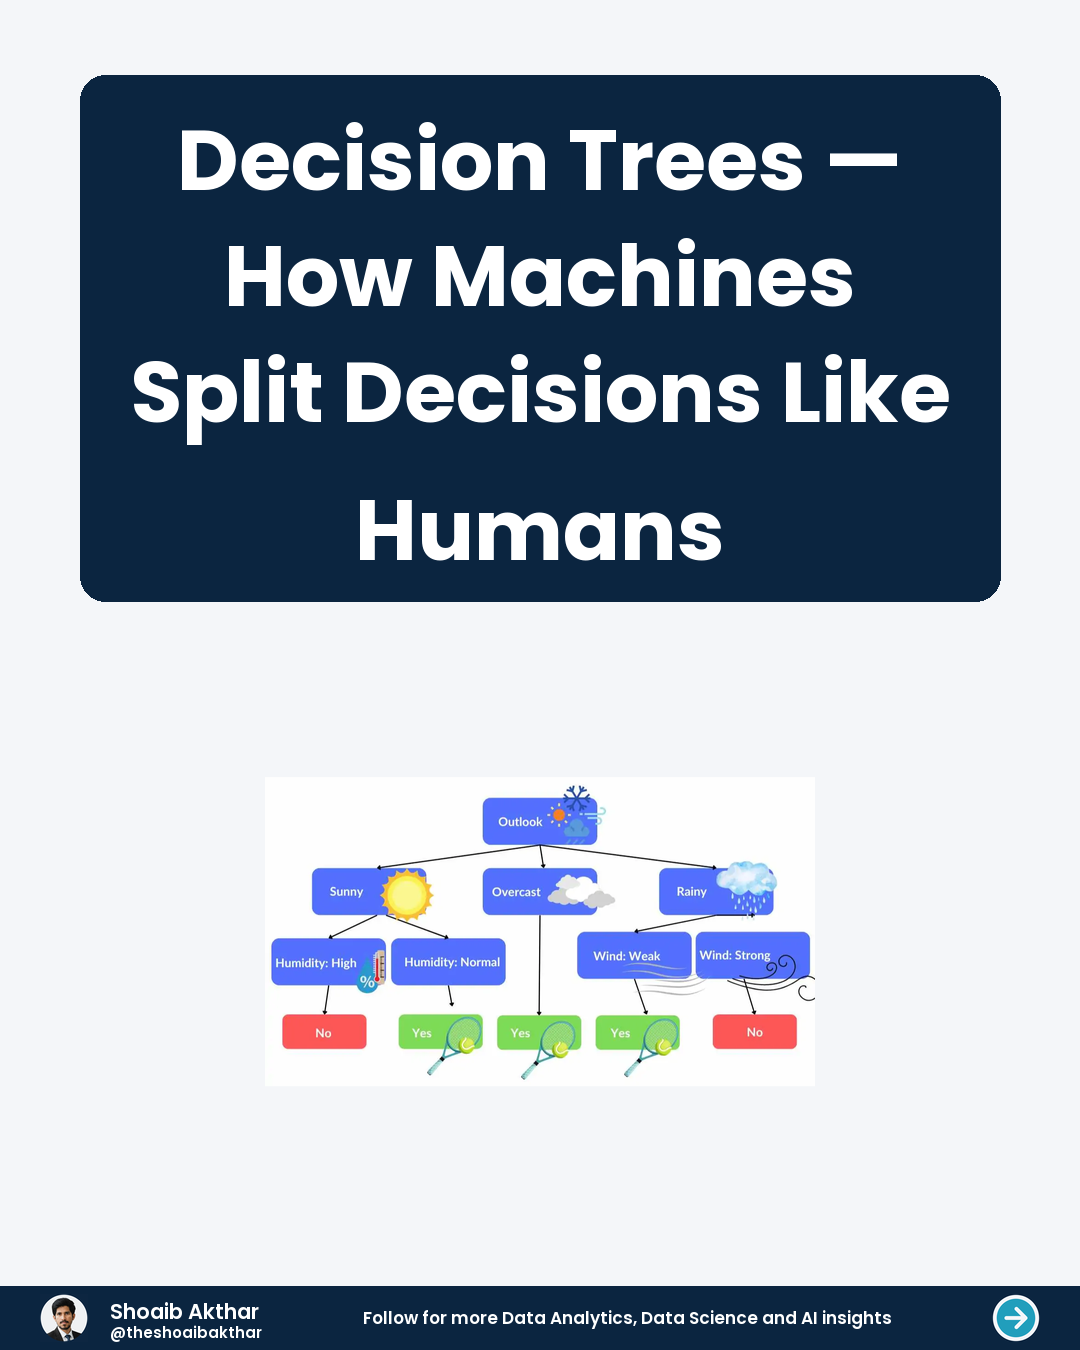
We make decisions every day by asking simple yes/no questions. For instance, deciding what to wear might start with "Is it raining outside?". Based on the answer, you follow a different path of reasoning. Machines can mimic this exact same process using a structure called a decision tree. It's a model that breaks down a complex decision into a series of simpler, binary choices, just like a flowchart.
 View Slides
The system's purpose is to find patterns in data. It uses these patterns to make predictions or decisions.
 View Slides
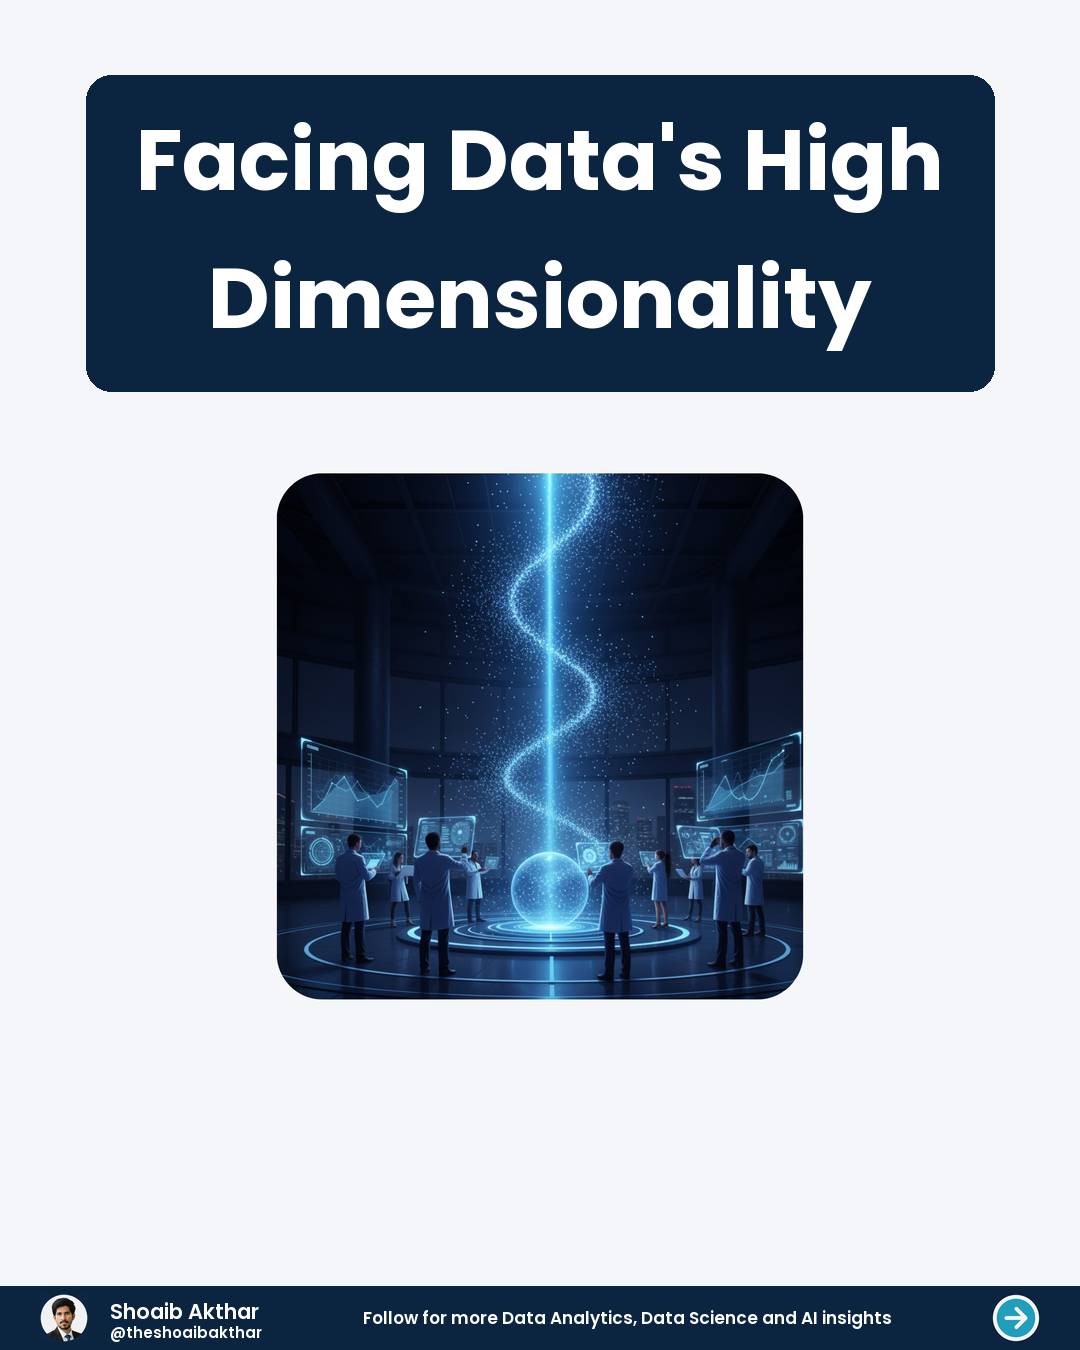
Dimensionality refers to the number of features in your data. Imagine describing a person using height, weight, and age – that's 3 dimensions.
 View Slides
The crucial step of cleaning and preparing raw data. It transforms messy, real-world data into a usable format.
 View Slides
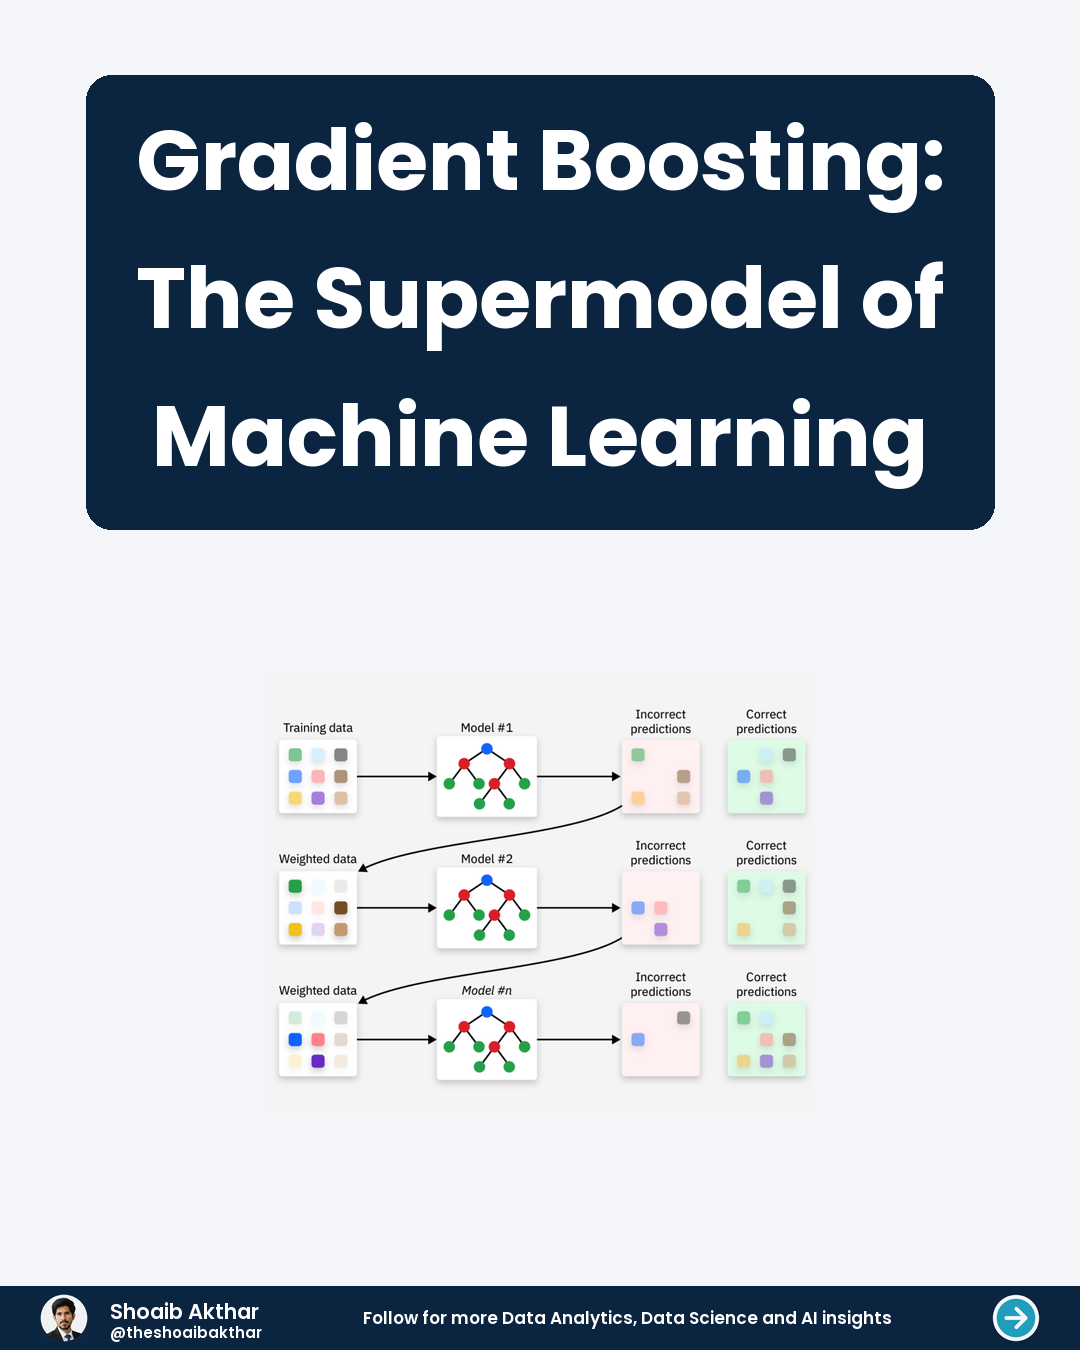
Boosting is an ensemble learning technique. It combines many weak models to create one strong, accurate predictor. Think of it as a team where every member contributes a small piece to the final solution. A weak model, often a shallow decision tree, is only slightly better than random guessing. By itself, its predictions are not very useful. The magic of boosting lies in how it strategically combines these weak links into a strong chain.
 View Slides
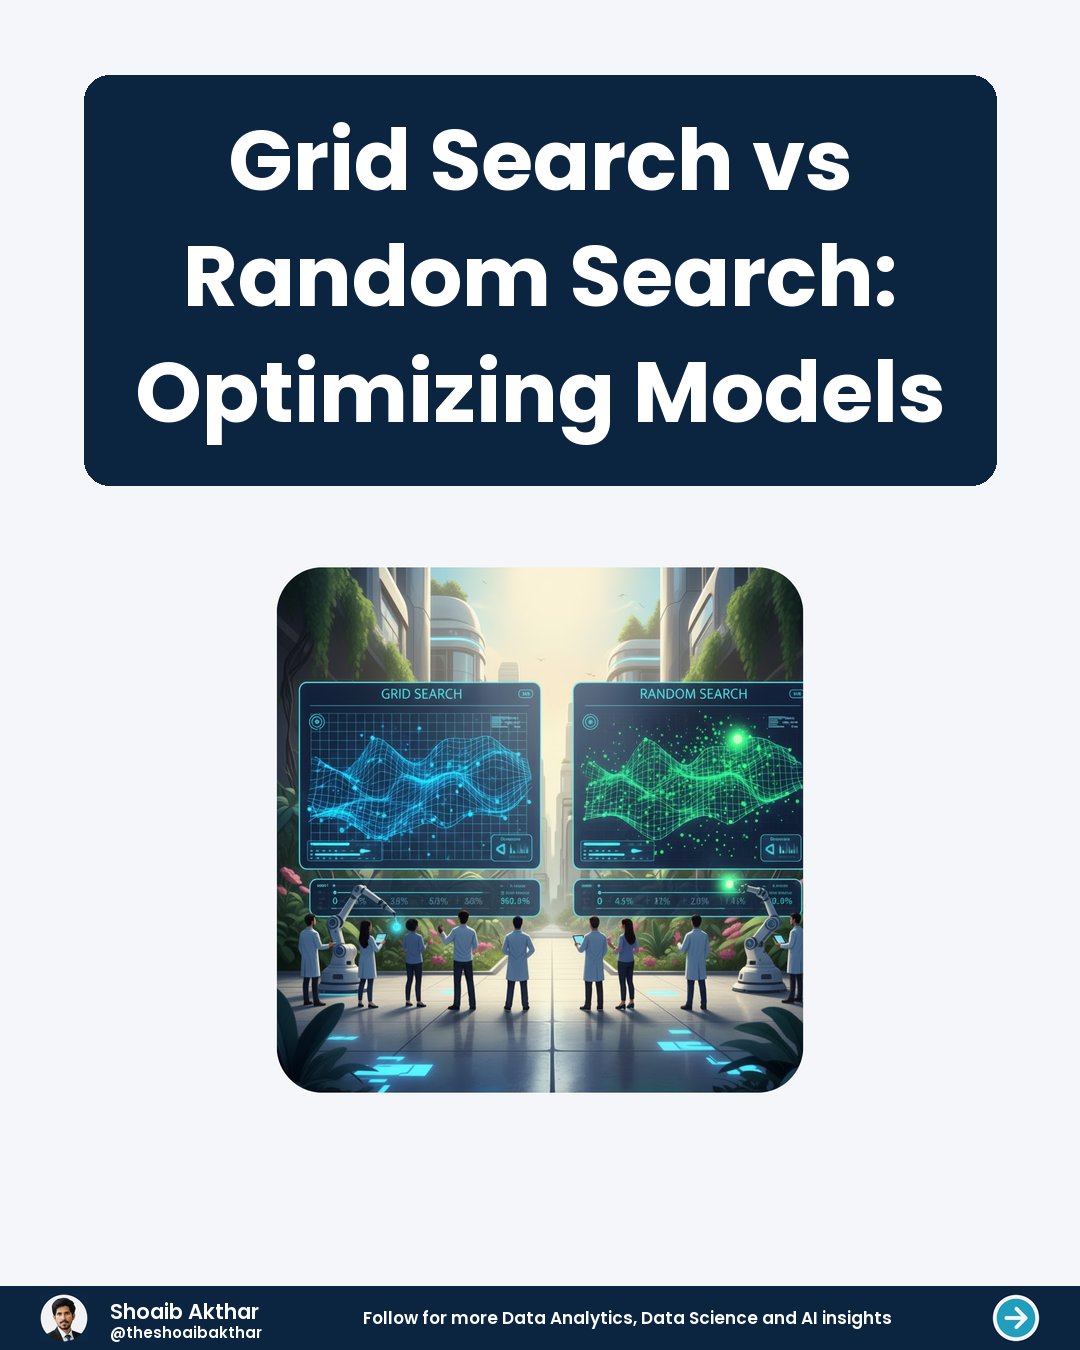
Grid search is a method for hyperparameter tuning where you define a grid of possible values for each hyperparameter. The algorithm then evaluates all possible combinations within this grid to find the best one. This approach is exhaustive, meaning it checks every possible combination, ensuring no potential best combination is missed. However, this can be computationally expensive, especially with many hyperparameters or a large search space.
 View Slides
Teach a machine to find patterns. Use these patterns to make predictions.
 View Slides
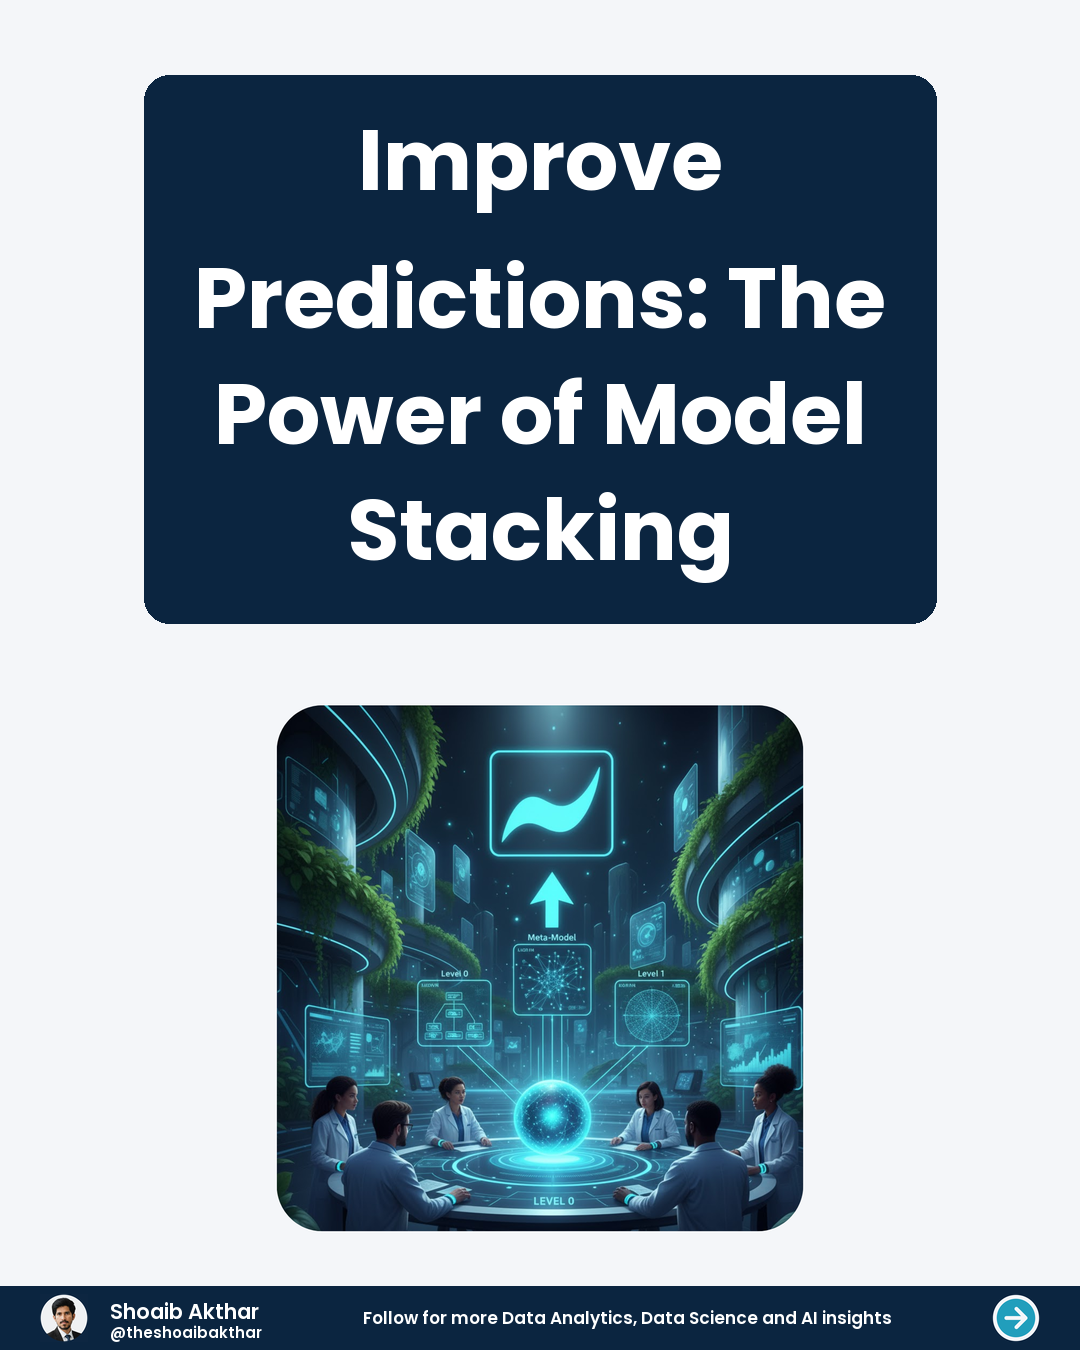
Model stacking combines the strengths of multiple machine learning models. It addresses limitations of individual models by leveraging their diverse approaches to problem-solving. This technique often leads to more robust and accurate predictions than relying on a single model alone. It’s a powerful approach because different models excel at different aspects of prediction. One model might be great at identifying trends, while another is better at handling outliers. Stacking allows us to combine these advantages for improved performance.
 View Slides
Use the Remove Duplicates feature in Power Query Editor. Select the columns that define a unique record.
 View Slides
Dimensions hold descriptive data like customer or product info This data is not static and can change over time
 View Slides
Isolate and analyze your DAX code independently See the exact query being sent to the data model
 View Slides
Machine learning models learn patterns from data. The goal is to predict new, unseen data accurately.
 View Slides
A core goal of good data modeling is speed Fast reports mean happy and productive users
 View Slides
Reports feel slow and unresponsive Users complain about long loading times
 View Slides
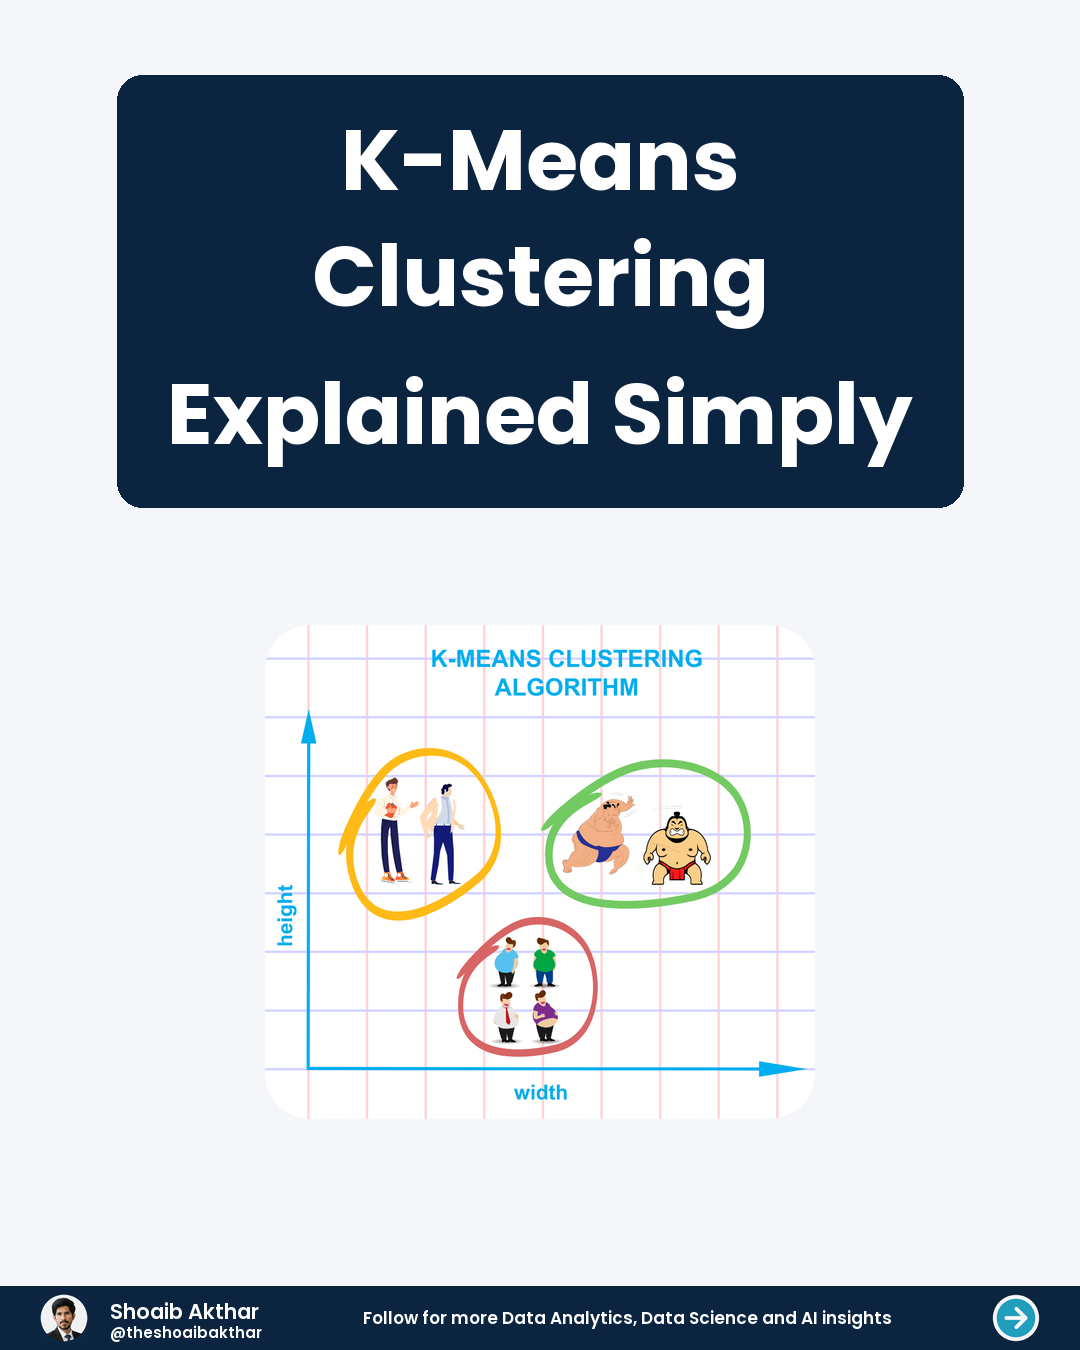
Clustering is an unsupervised machine learning technique. Its goal is to group similar data points together. It helps discover hidden patterns in data without prior labels. Think of it as organizing a messy closet. You group shirts, pants, and socks together based on their type. K-Means is a popular algorithm that performs this task automatically.
 View Slides
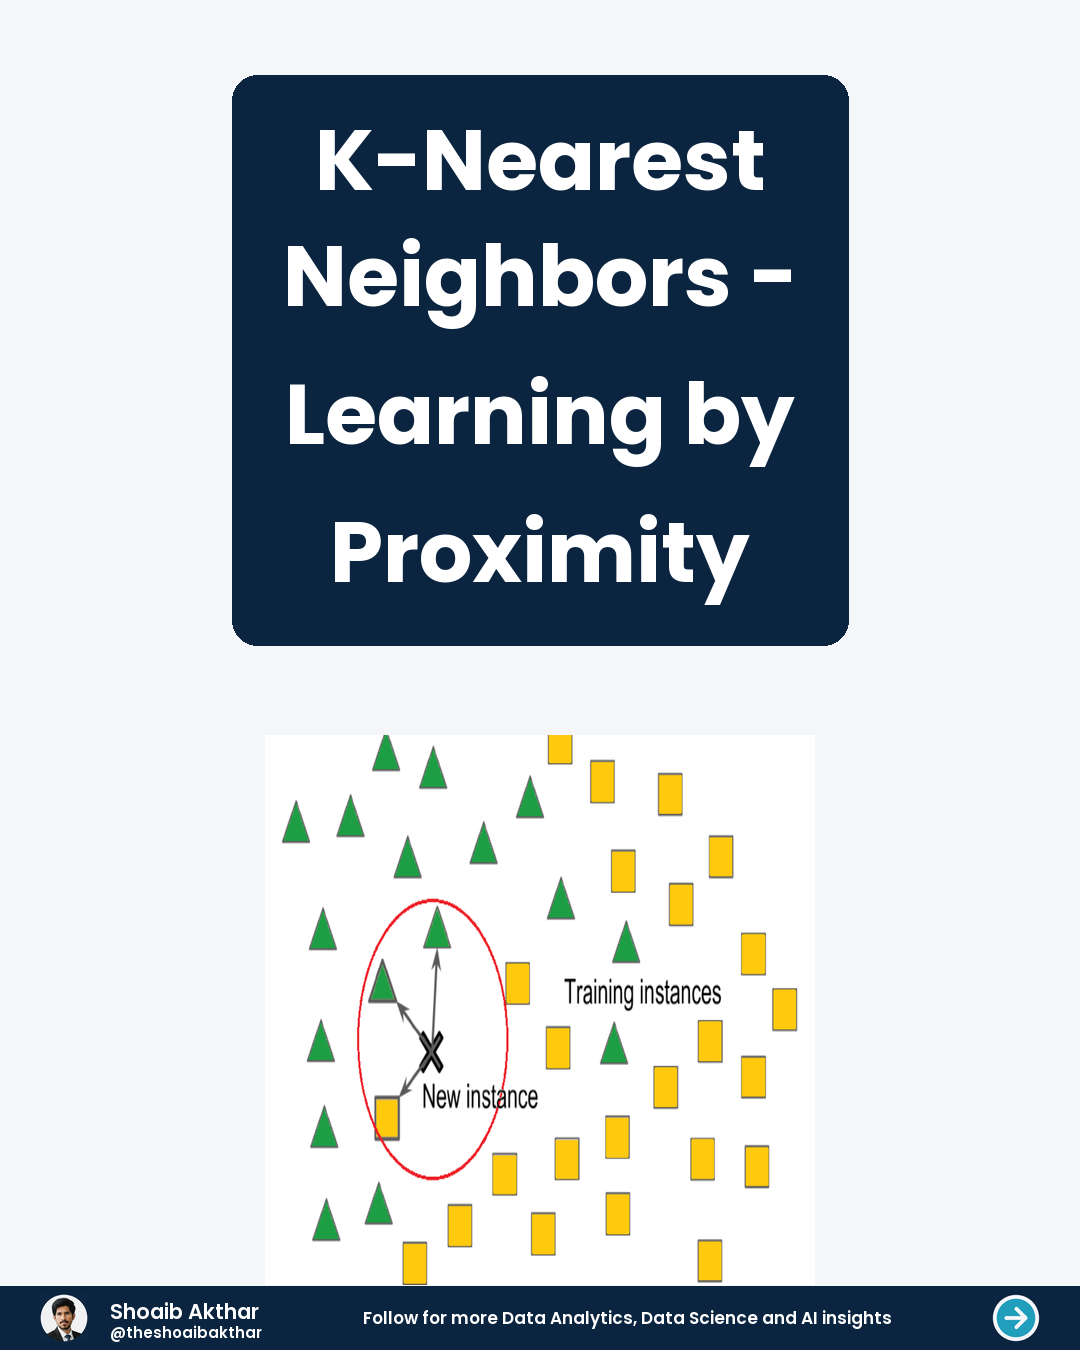
K-Nearest Neighbors is a simple, versatile machine learning algorithm. It can be used for both classification and regression tasks. Its core principle is that similar data points exist close to each other. It is called an instance-based or lazy learning algorithm. This is because it doesn't build a model during a training phase. Instead, it memorizes the entire training dataset and makes predictions only when needed.
 View Slides
What is Feature Engineering? It's the art of creating new features from existing data. Think of it as transforming raw data into something more useful for your machine learning models. Good features help the model learn patterns more effectively, leading to better accuracy and performance.
 View Slides
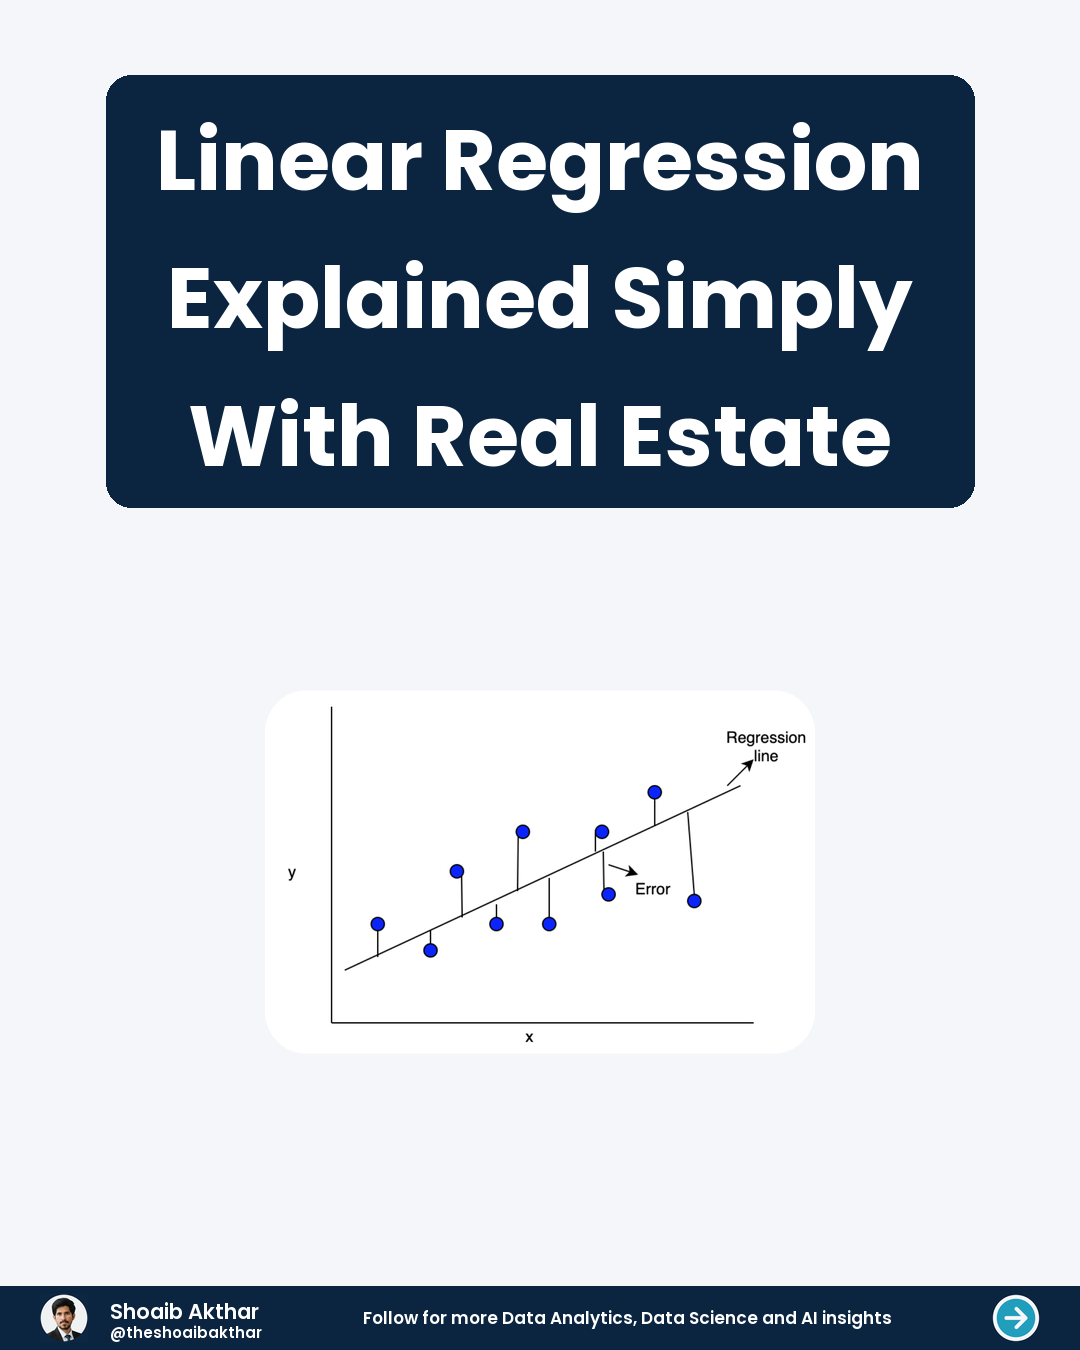
What Is Linear Regression? Linear regression is a fundamental statistical method. It models the relationship between a dependent variable and one or more independent variables. The goal is to find a straight line that best fits the data points.
 View Slides
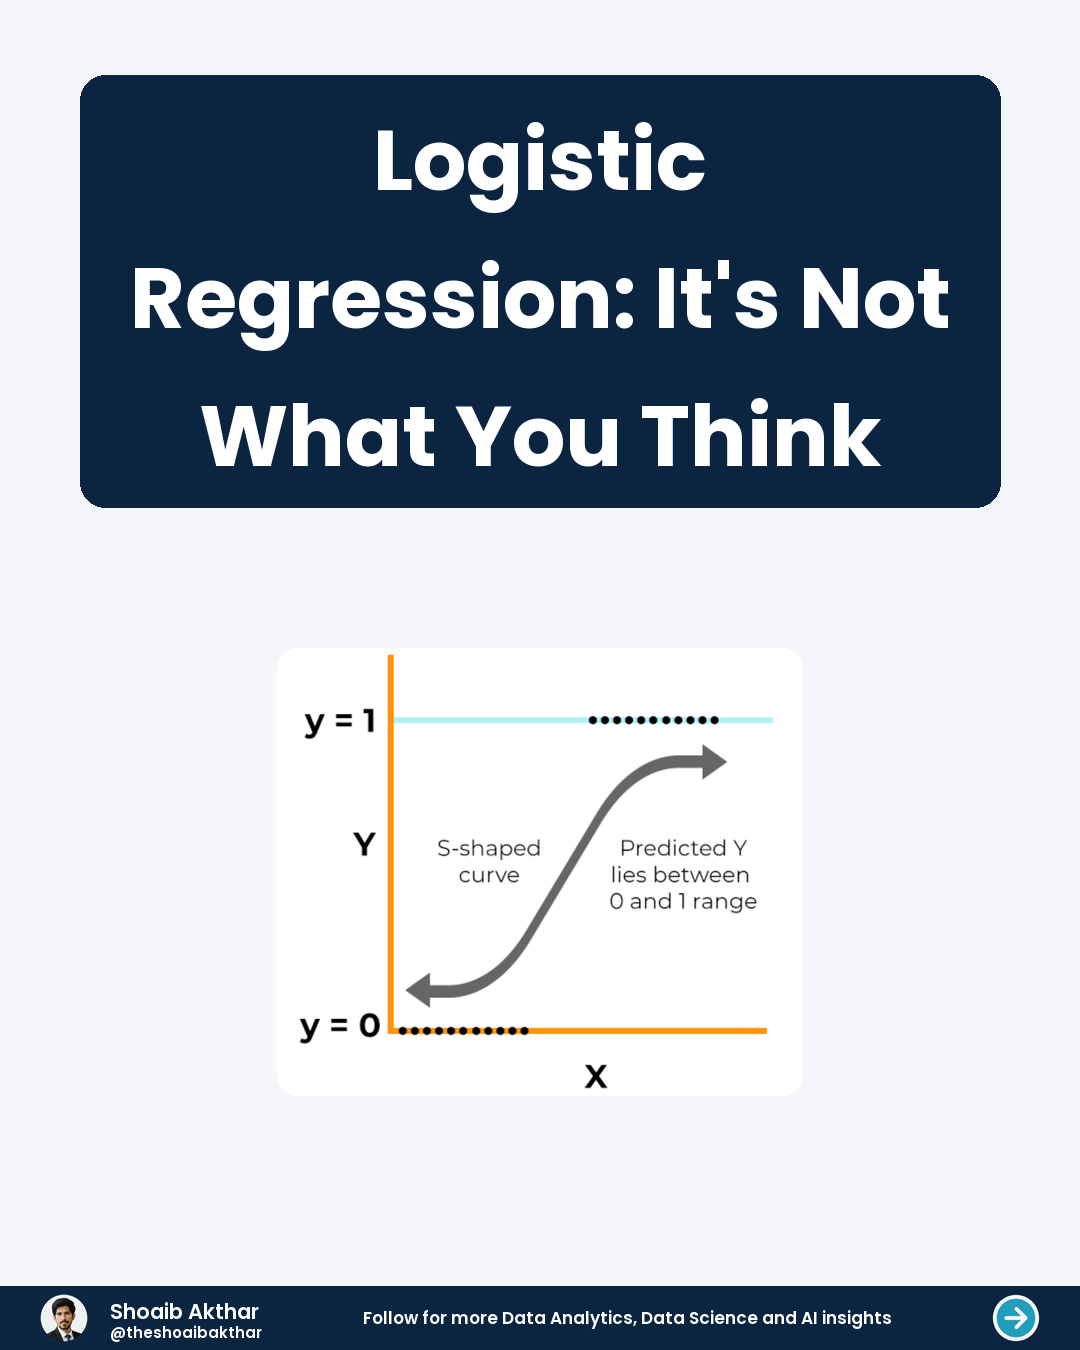
Logistic regression has a confusing name. It contains the word "regression," which typically describes predicting a continuous number. But this algorithm is actually used for classification tasks. It predicts which category an observation belongs to. For example, it can classify an email as spam or not spam. It can predict if a transaction is fraudulent or legitimate.
 View Slides
Traditional: Programmer writes explicit rules (IF-THEN). ML: Algorithm finds patterns and writes its own rules.
 View Slides
Understanding Markov Property A state's future depends only on the present state.
 View Slides
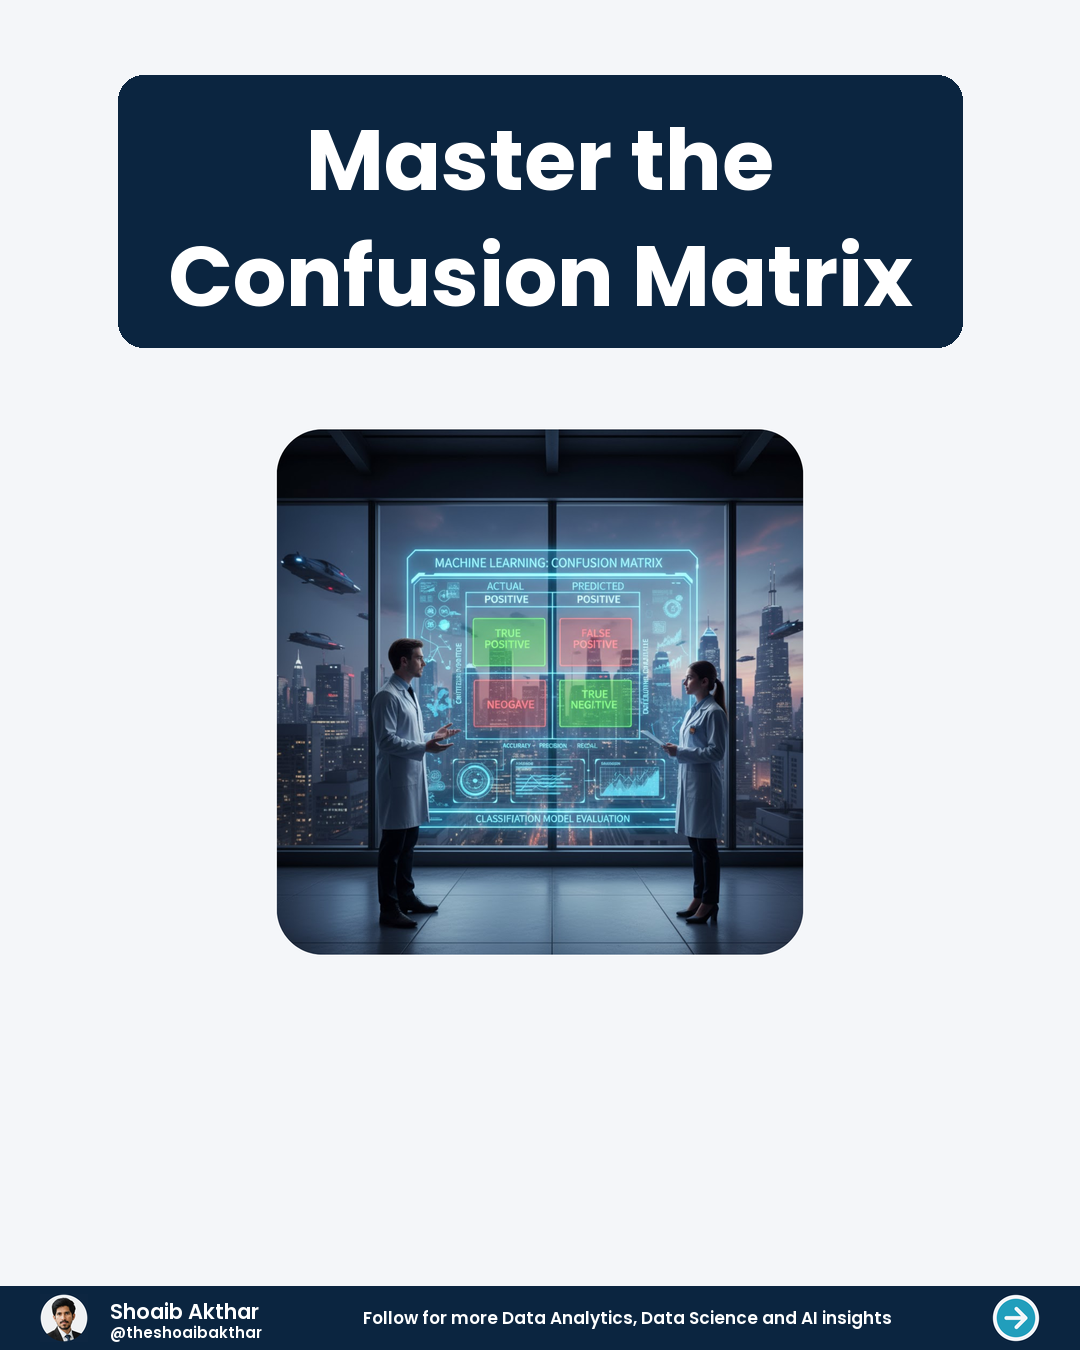
What is a Confusion Matrix? A confusion matrix is a table that helps evaluate the performance of a classification model. It shows how often predictions match actual outcomes. Think of it as a scorecard for your model's accuracy.
 View Slides
Excellent for comparing values across different categories. Ideal for showing changes in data over a period of time.
 View Slides
What are Python's key features and advantages? Explain lists, tuples, and dictionaries.
 View Slides
Hyperparameters are settings that control the learning process of machine learning models. Unlike model parameters, they are not learned from data but set before training begins. Examples include learning rate, number of trees in a random forest, or layers in a neural network. Hyperparameters define how a model learns from data. They influence the model's performance and efficiency. Choosing the right hyperparameters is crucial for building effective models.
 View Slides
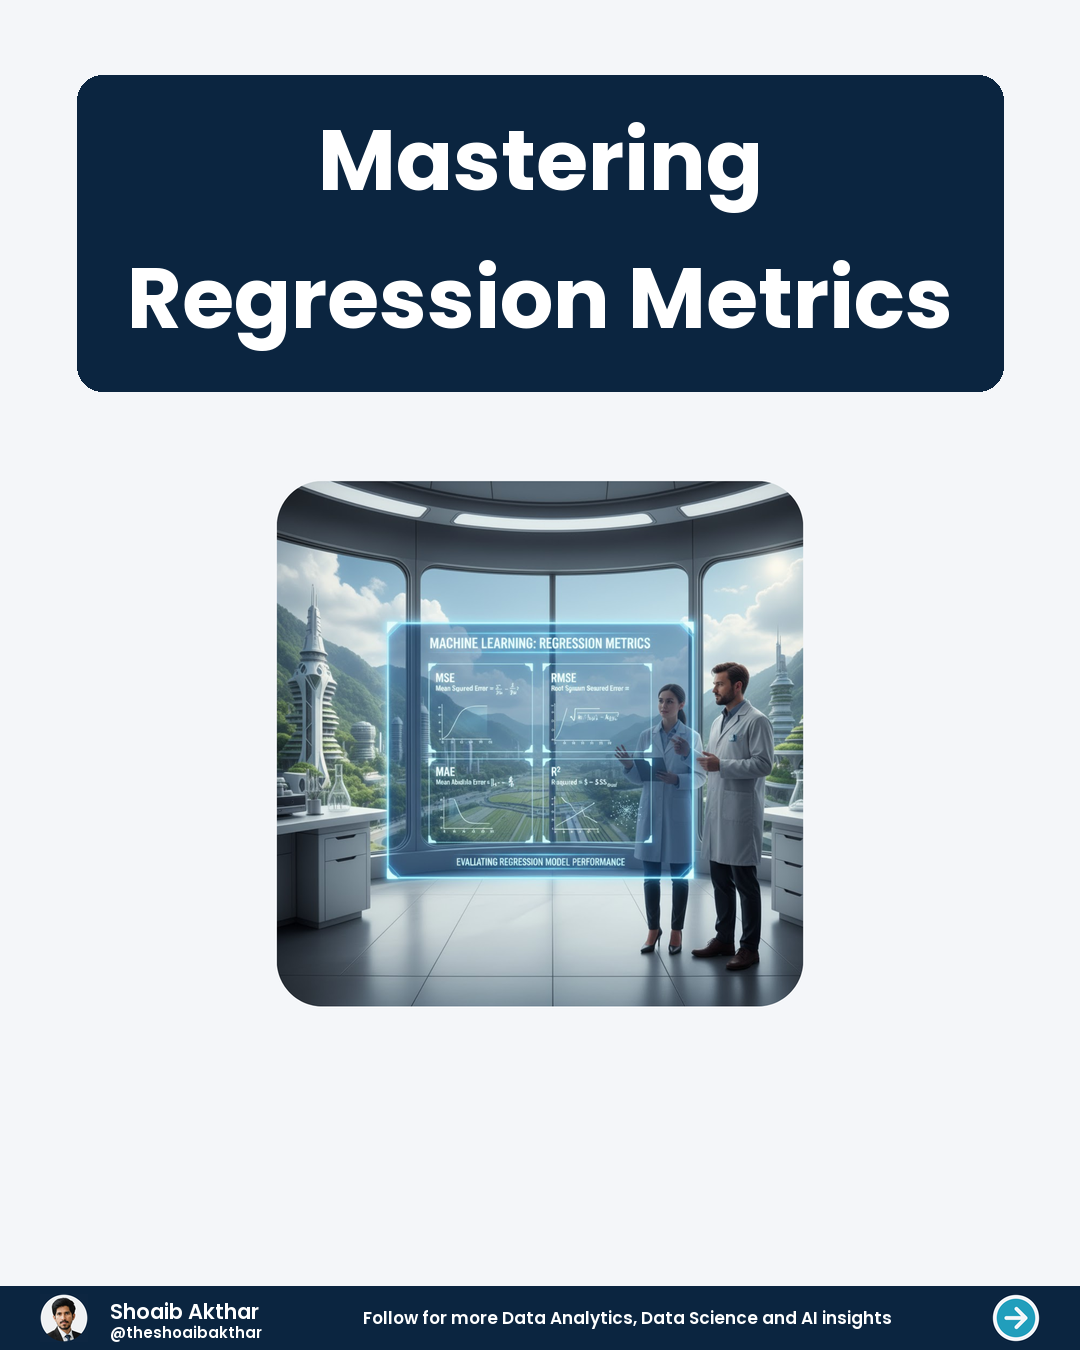
Mean Squared Error (MSE) measures the average squared difference between predicted and actual values. It gives higher weight to larger errors due to squaring. Lower MSE indicates better model performance. MSE is sensitive to outliers because squaring large errors amplifies their impact. It's always non-negative and in the same units as the target variable squared. This metric is widely used in machine learning for regression tasks.
 View Slides
A Composite Model blends Import and DirectQuery modes. It allows a single report to use both types.
 View Slides
What is Power BI and its key components? Differentiate between Power BI Desktop, Service, and Mobile.
 View Slides
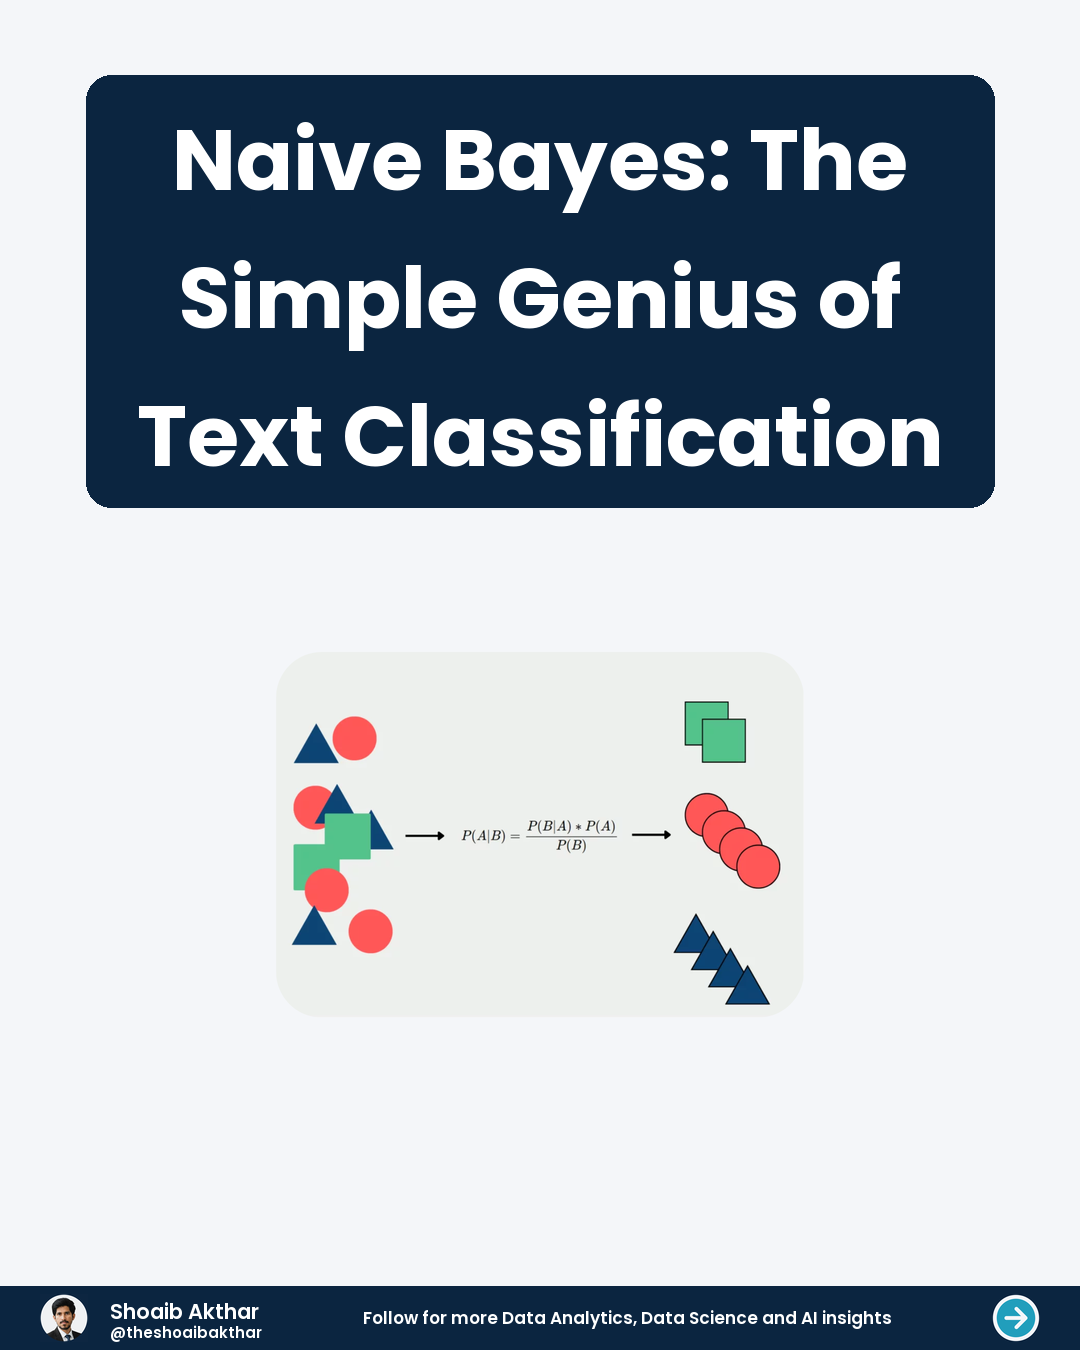
Naive Bayes is a family of simple probabilistic classifiers. They are based on applying Bayes' Theorem with a strong "naive" assumption of feature independence. Despite this simplicity, they often work very well, especially for text classification tasks like spam detection. They are called "naive" because it's a bold assumption to think every word in a document is independent of all others. In reality, words often appear together and influence each other's meaning. Yet, this very assumption is what makes the algorithm so computationally efficient and effective.
 View Slides
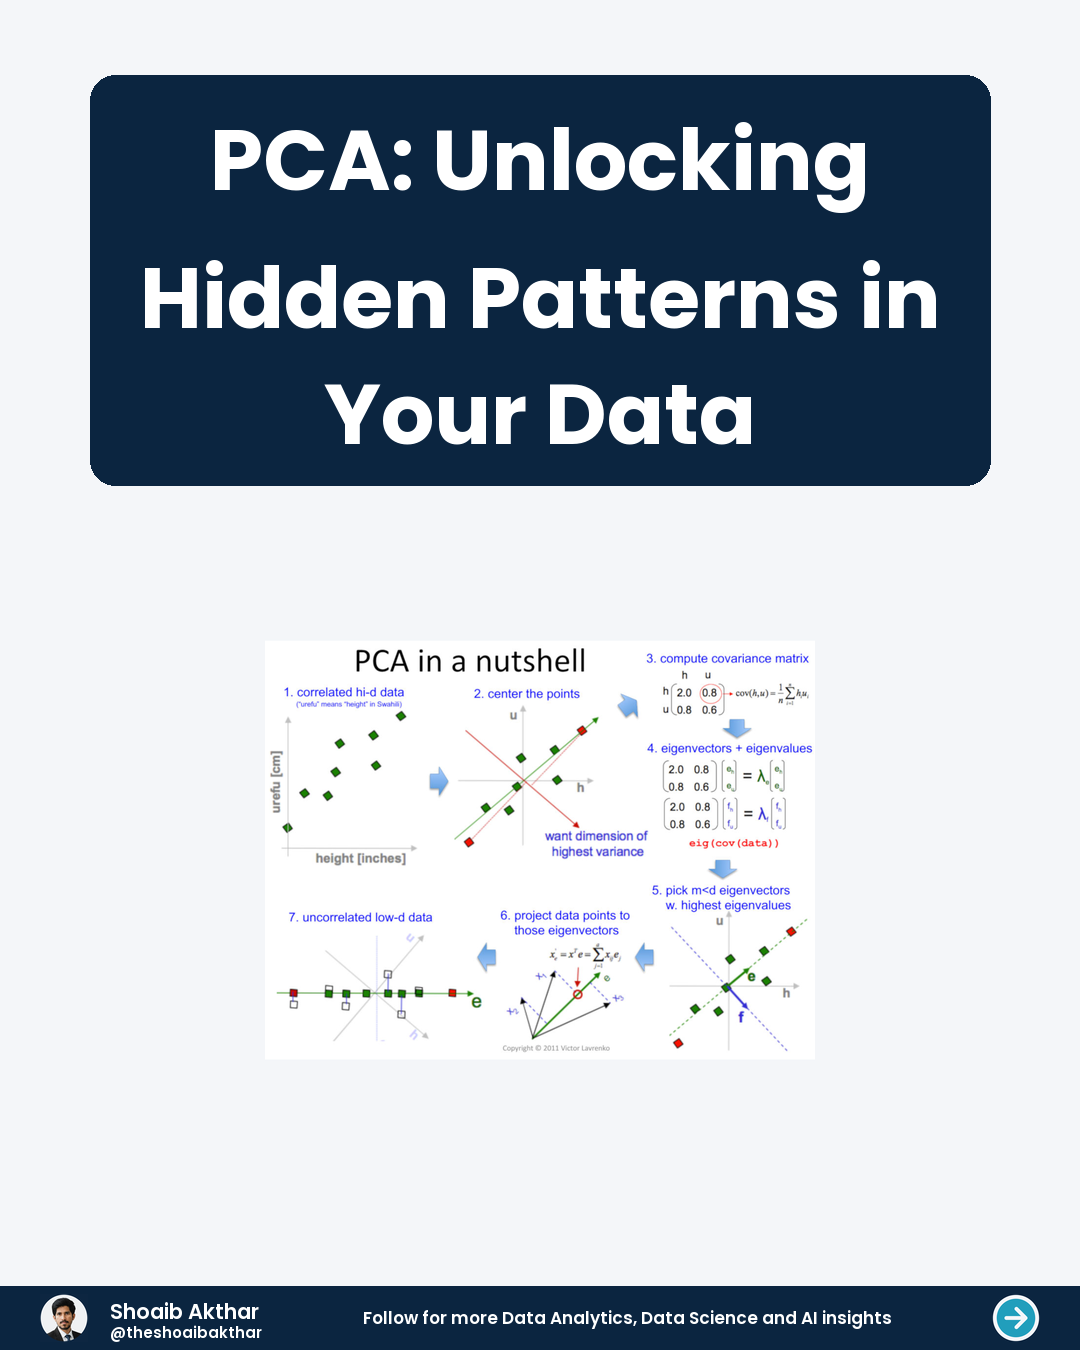
PCA is a data reduction technique. It transforms high-dimensional data into a lower-dimensional space.
 View Slides
Overfitting happens when our model learns the training data too well. It memorizes noise and specific details instead of general patterns.
 View Slides
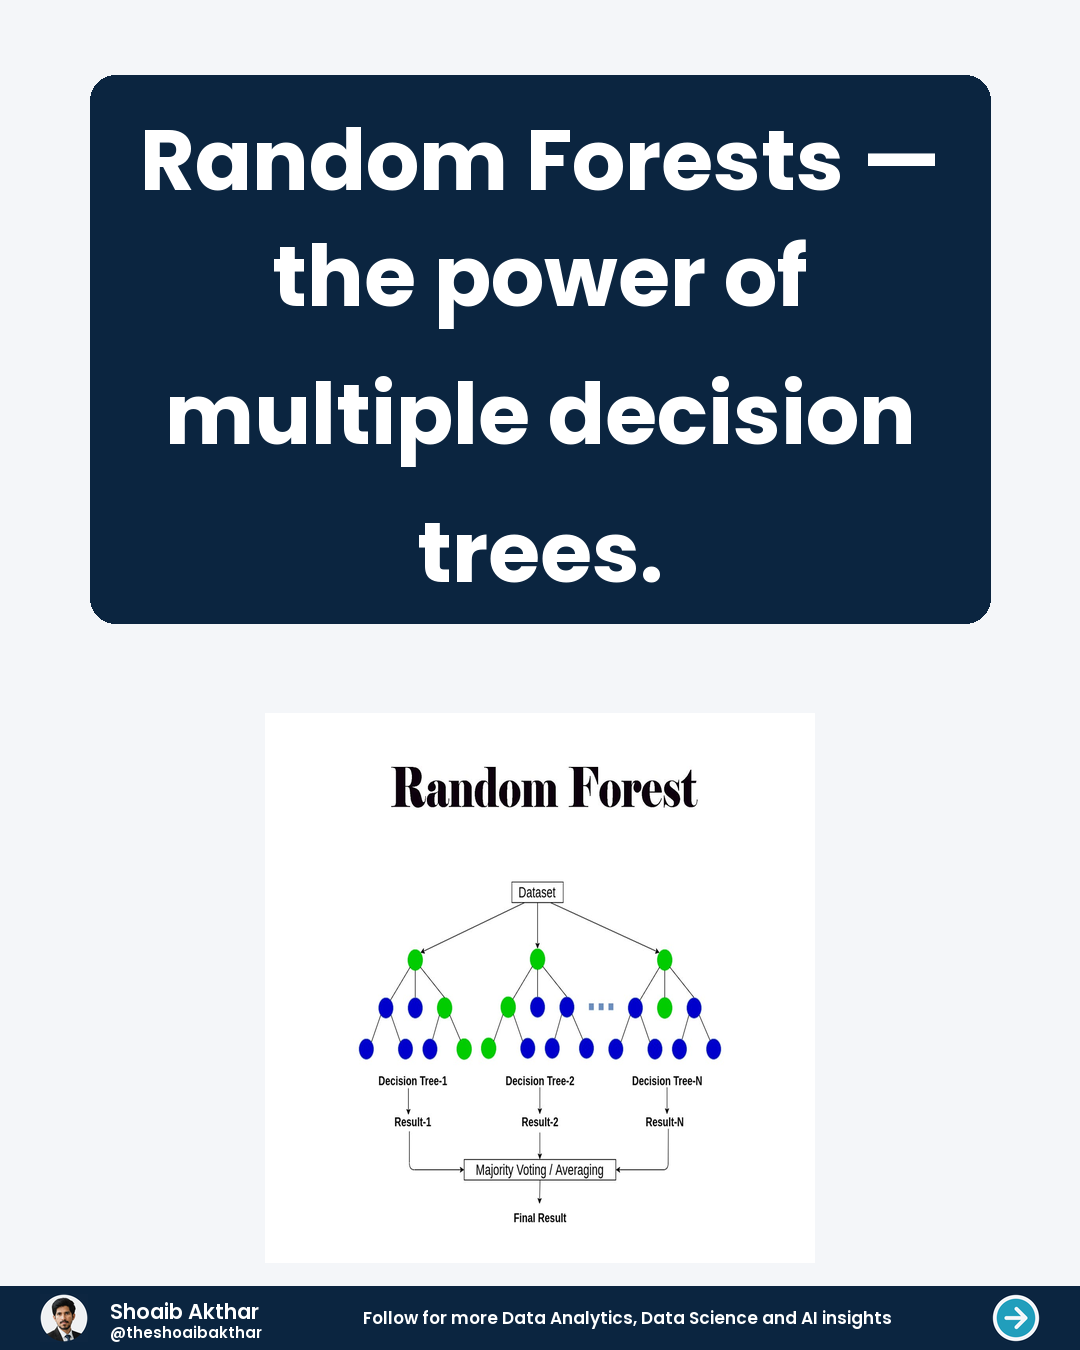
A single decision tree can be a powerful predictor. It asks a series of yes/no questions to classify data or predict values. However, this strength is also its biggest weakness. A single tree often becomes too complex and tailored to the training data. It memorizes the noise and specific details instead of learning the general pattern. This leads to poor performance on new, unseen data, a problem known as overfitting.
 View Slides
A security feature in Power BI Restricts data access for specific users
 View Slides
Bar charts compare quantities across different categories. Use them to show rankings or highlight differences.
 View Slides
An anomaly is something that deviates significantly from what is considered normal or expected. It's an unusual event, pattern, or observation. Recognizing these deviations is crucial in many fields, from cybersecurity to finance. Identifying anomalies allows us to investigate and potentially take corrective action before problems escalate. Detecting an anomaly doesn’t always require a precise definition of “normal.” Sometimes, the expected behavior is complex and difficult to determine. Statistical methods and machine learning algorithms are employed to identify patterns and flag those that fall outside those patterns.
 View Slides
Data is often split across multiple tables Joins combine this data for meaningful insights
 View Slides
Saves you hours of repetitive manual work Reduces human error in deployment processes
 View Slides
Retrieves data from specified columns in a table. FROM pinpoints the exact table you want to query.
 View Slides
`CURRENT_DATE` returns today's date from your system. `CURRENT_TIME` fetches the current time of day.
 View Slides
Gain real-time insights without waiting for dashboards Customize metrics to fit your exact business questions
 View Slides
Large datasets can be slow and expensive to refresh A full refresh processes every single row every time
 View Slides
A Power BI feature for data preparation. Lets you build reusable data transformations.
 View Slides
Process data without collapsing rows Perform calculations across related rows
 View Slides
The foundational library for data manipulation and analysis Works with tabular data, like spreadsheets or database tables
 View Slides
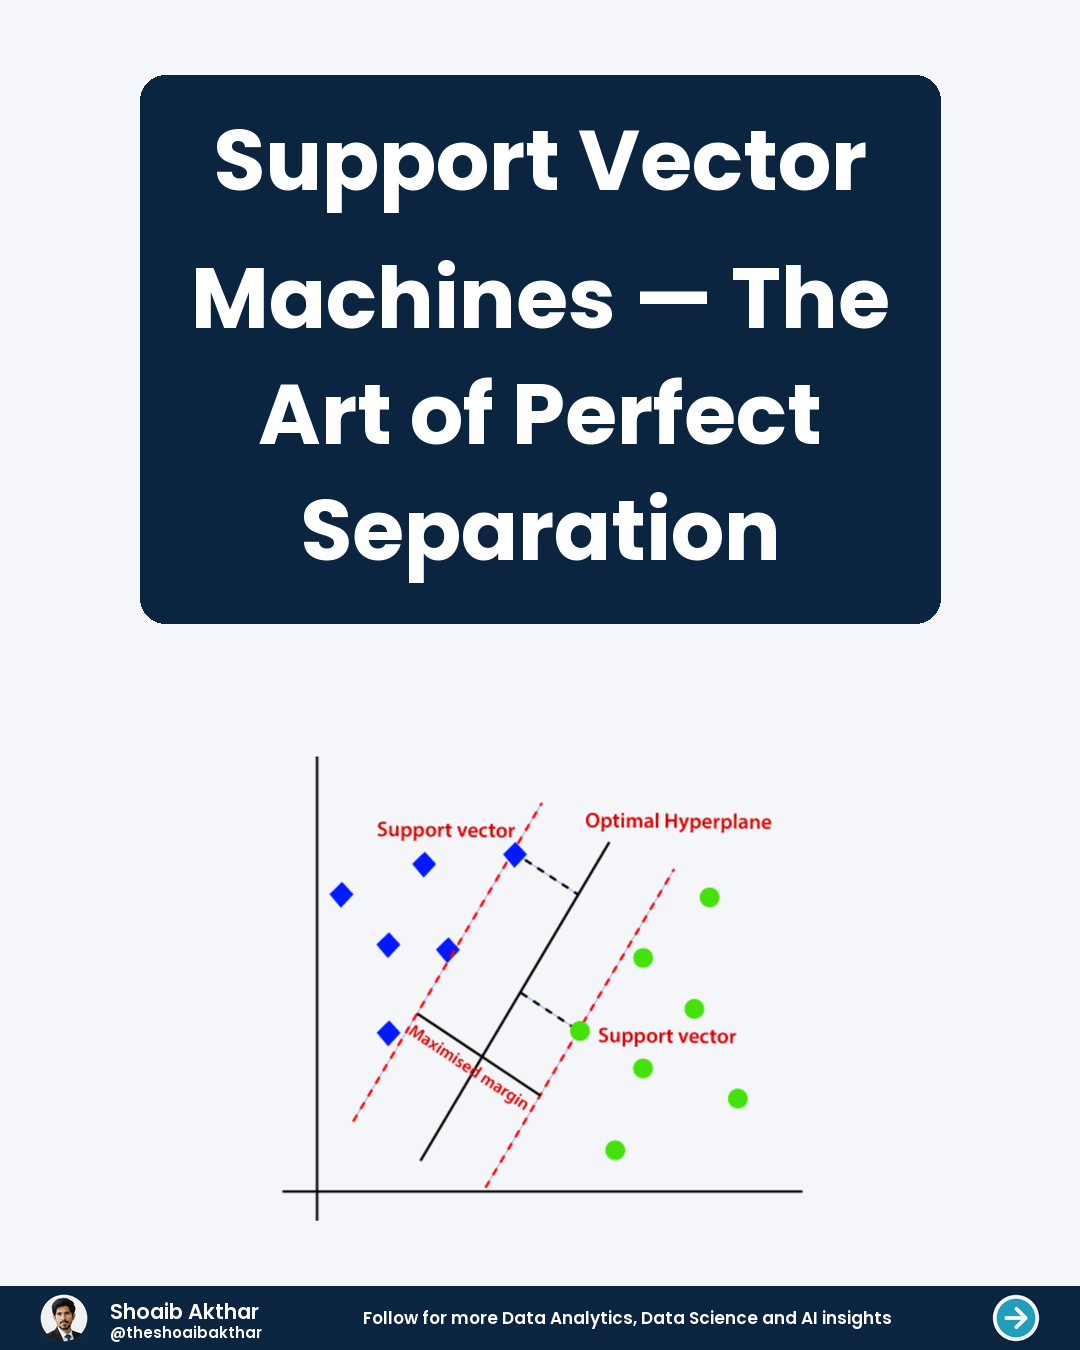
Imagine you have two distinct groups of data points on a graph. Your goal is to draw a line that best separates them. This is the fundamental task of classification, and Support Vector Machines are masters at it. They don't just draw any separating line. They search for the one that creates the widest possible "street" between the groups. This street is called the margin, and its width is crucial for the model's performance.
 View Slides
Pressure is mounting to deploy generative AI solutions. A familiar question is surfacing: Is there an AI bubble?
 View Slides
Unlock insights hidden in free-text survey responses Understand customer sentiment from reviews and feedback
 View Slides
Combine rows from two or more tables. Based on a related column between them.
 View Slides
Connecting different data sources is the first big hurdle Cleaning and transforming messy data takes most of your time
 View Slides
Many reports need time intelligence measures Think Year-to-Date (YTD), Month-to-Date (MTD)
 View Slides
What Are Tools in Agentic AI? Tools are external capabilities that an AI agent can use to perform tasks beyond generating text.
 View Slides
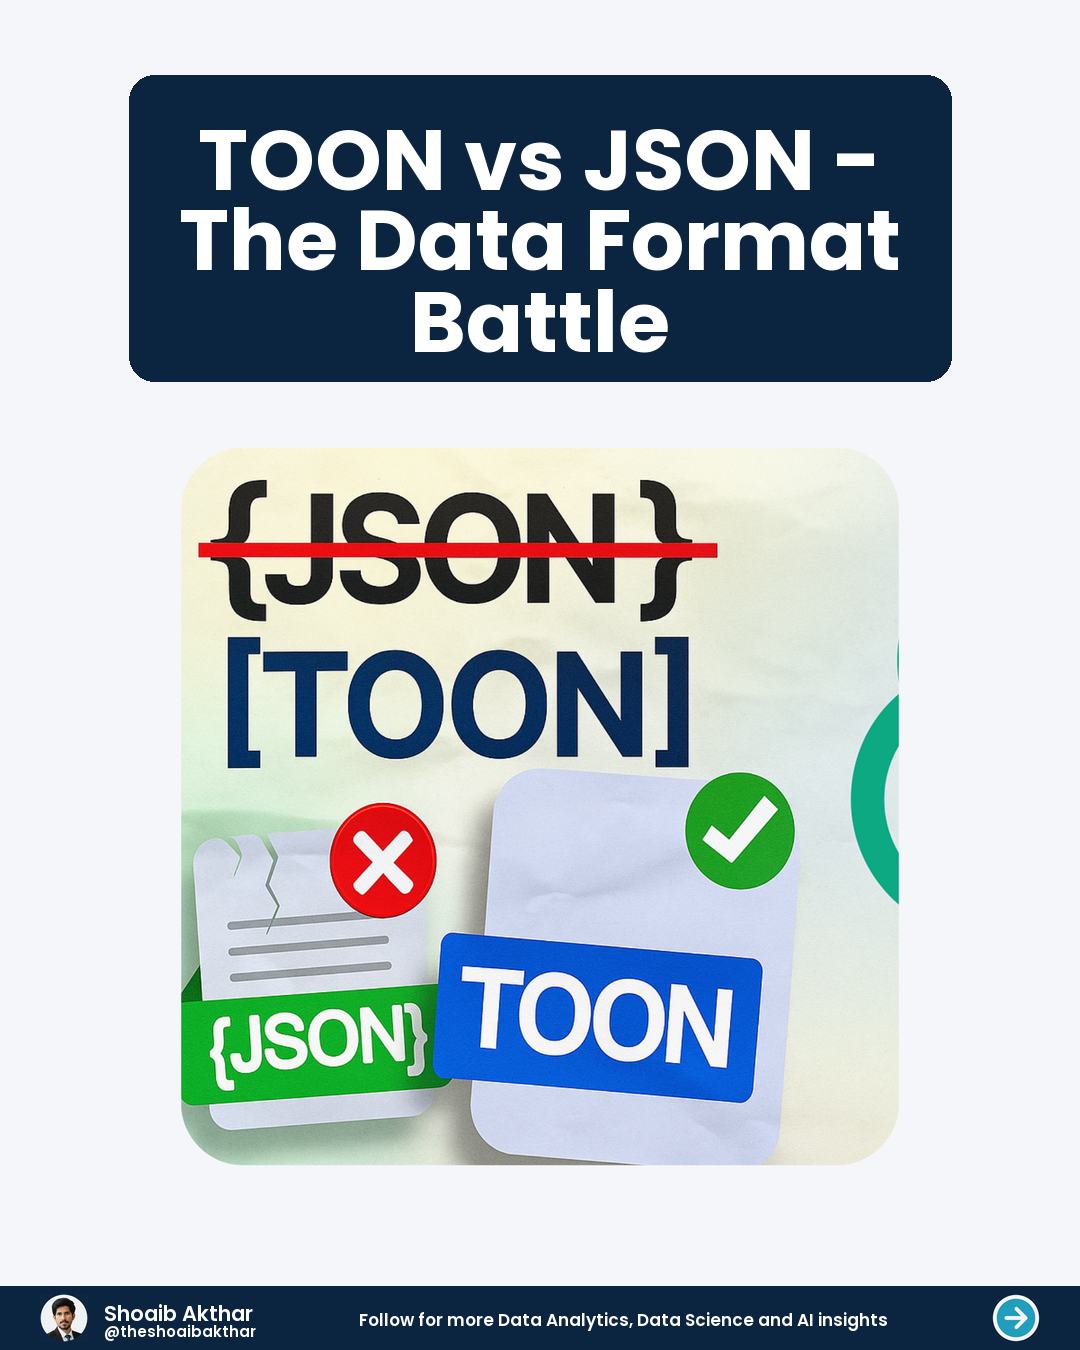
JSON remains the universal standard for transferring data, but struggles with AI-driven workloads. TOON is built for large language models (LLMs), aiming to shrink data size for faster AI processing.
 View Slides
A model defines how your data tables connect. It is the foundation for all your reports.
 View Slides
Machine learning models learn patterns from data. This process is split into two critical phases.
 View Slides
Naive RAG — The Basic Approach Naive RAG follows the simplest RAG pipeline: retrieve relevant information and give it to the LLM for generation.
 View Slides
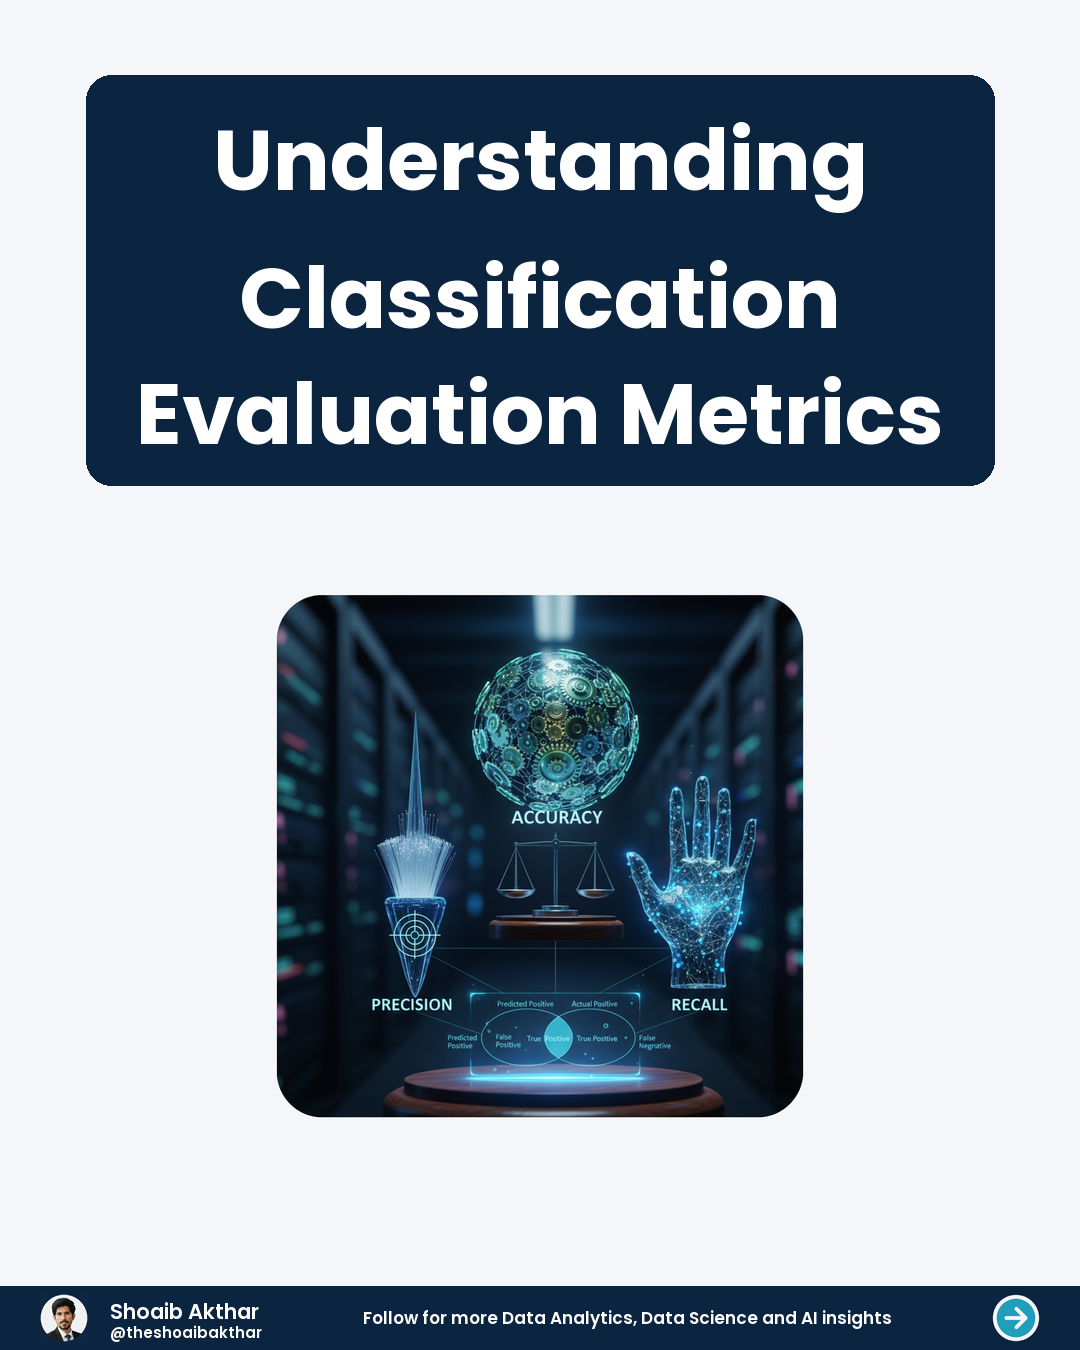
Accuracy is the overall correctness. It measures the percentage of correct predictions.
 View Slides
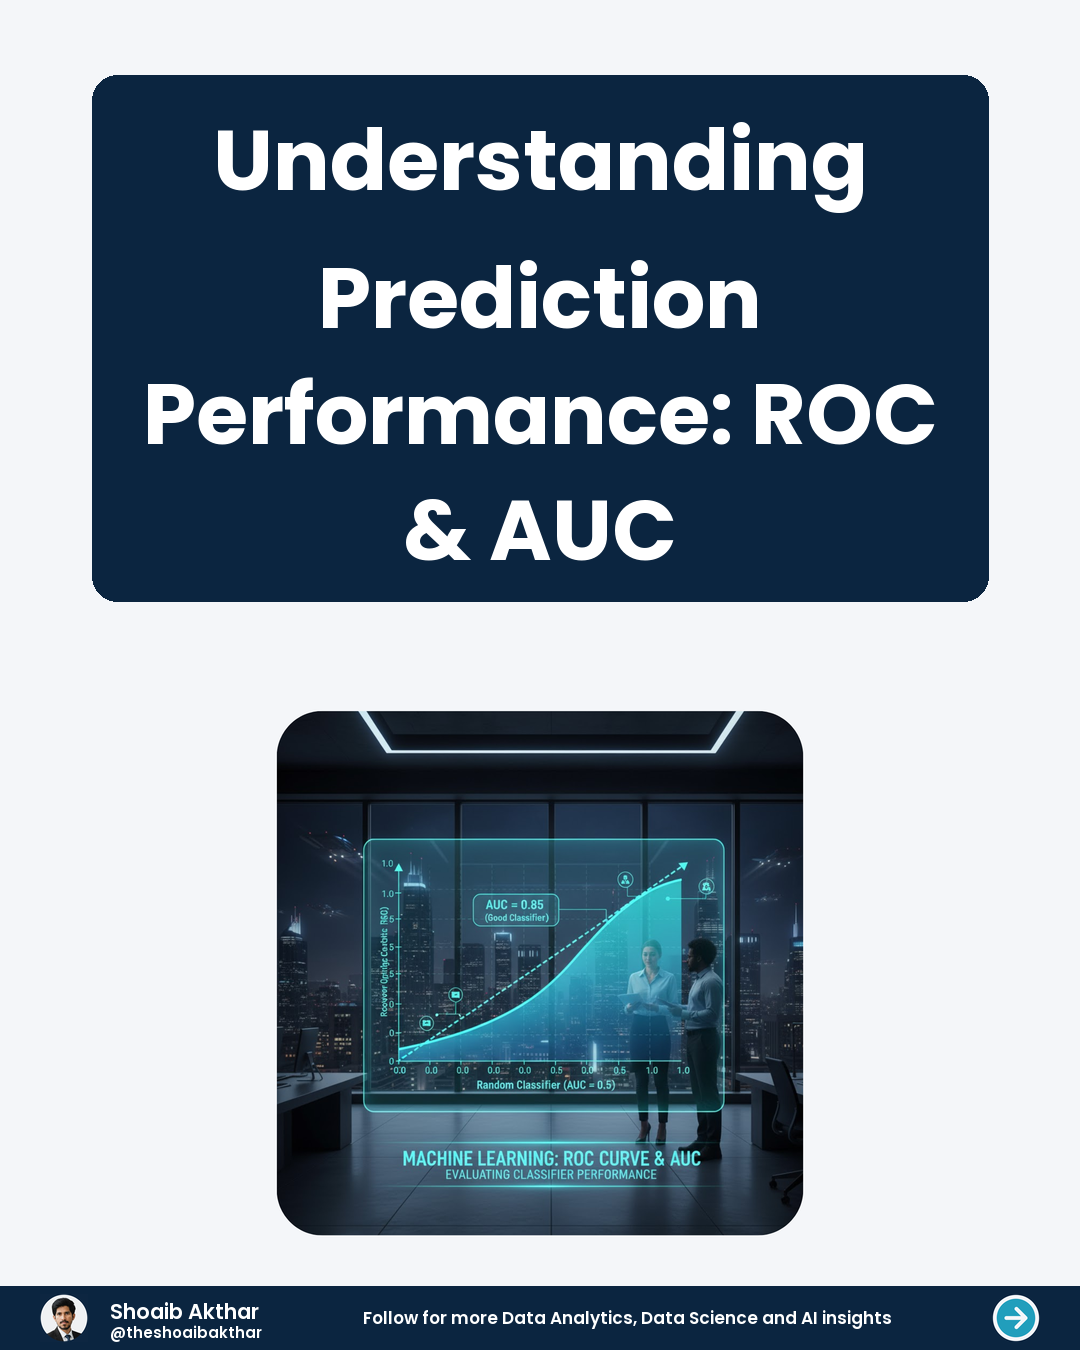
The Receiver Operating Characteristic curve visualizes how well a classification model distinguishes between different classes. It plots the true positive rate against the false positive rate at various threshold settings. Think of it as a graph showing the trade-off between correctly identifying positive cases and incorrectly identifying negative cases as positive. A higher ROC curve generally indicates a better model; a model that effectively separates positive and negative instances. Different classification algorithms will produce varying ROC curves, representing their different strengths. Understanding ROC helps us compare and select the best model for our specific problem.
 View Slides
RAG stands for Retrieval Augmented Generation It is a technique that improves AI answers
 View Slides
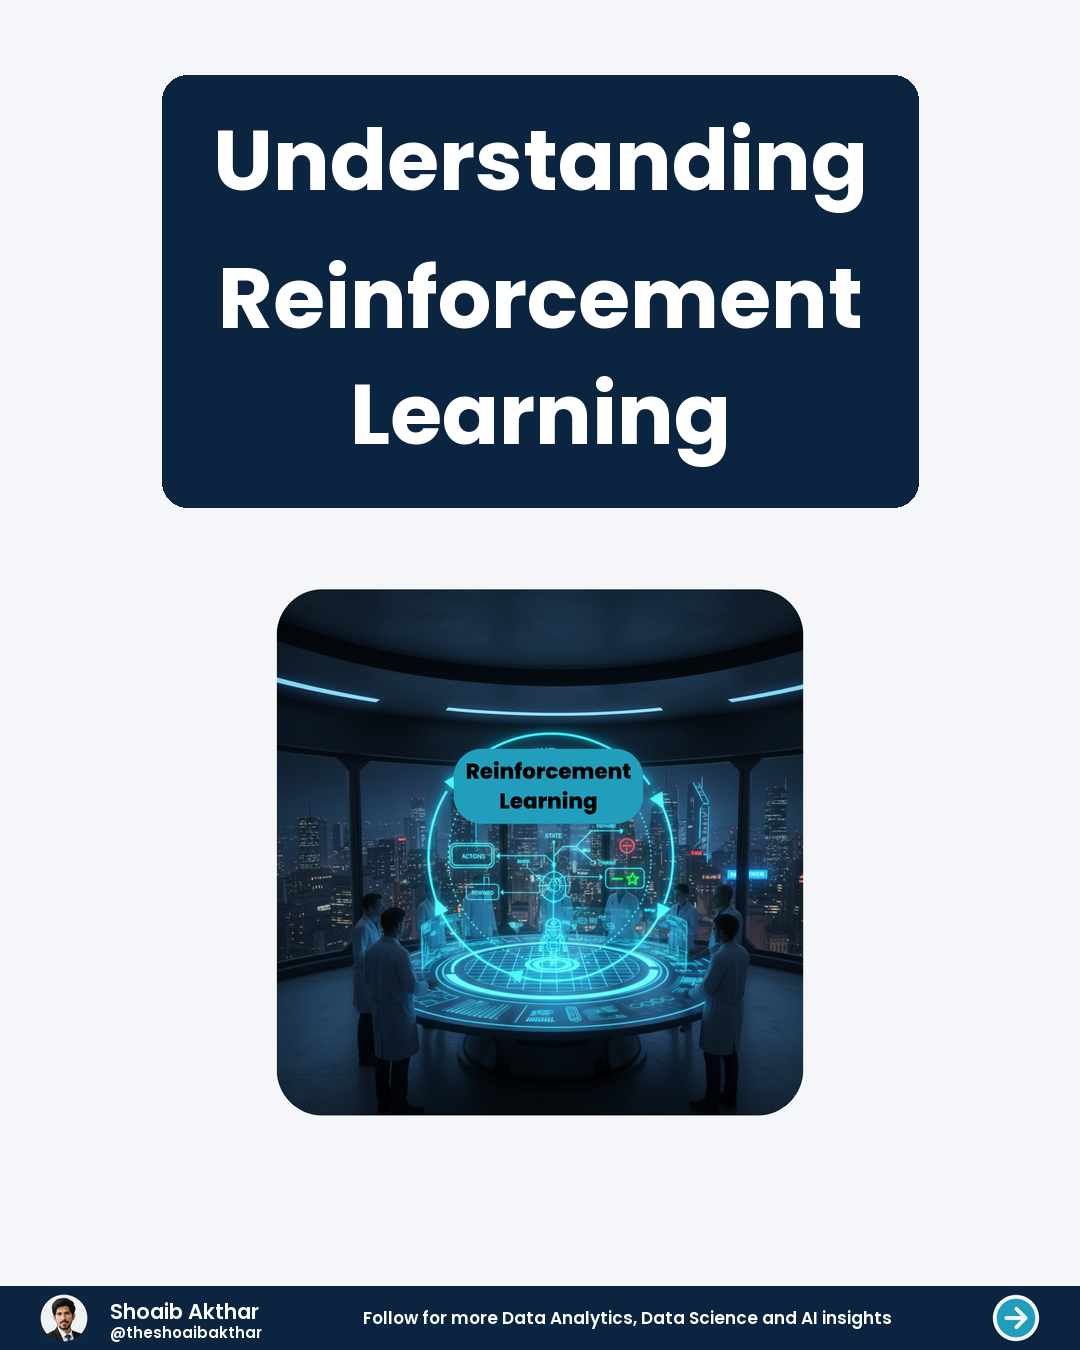
Reinforcement Learning is a type of machine learning. It focuses on training agents to make decisions in an environment.
 View Slides
Combines data transformations into one SQL-like query Prevents pulling raw data into Power BI
 View Slides
They capture the current state of a report page This includes filters, slicers, and visual visibility
 View Slides
What is Transfer Learning? It’s learning from one task to another.
 View Slides
They capture the state of a report page. This includes filters, slicers, and visibility.
 View Slides
Data points indexed in chronological order Measured at consistent time intervals
 View Slides
Think of them as a super-powered GROUP BY They perform calculations across a set of table rows
 View Slides
Easy to learn and read, like plain English Huge community support and endless resources
 View Slides
The CALCULATE Game-Changer Dynamically modifies filter context in your reports.
 View Slides
VLOOKUP searches for a value in the first column of a range. XLOOKUP can search in any column of a range.
 View Slides
Control who can see your reports and data Prevent unauthorized access to sensitive information
 View Slides
Feature scaling is a technique to adjust the range of features in a dataset. It ensures that all features contribute equally to machine learning models. Without scaling, features with larger values can dominate the model. Normalization and standardization are two common scaling methods. Normalization scales data to a fixed range, usually between 0 and 1. Standardization transforms data to have a mean of 0 and a standard deviation of 1.
 View Slides
What is Ensemble Learning? Ensemble learning combines multiple machine learning models to improve performance. Instead of relying on a single model, it leverages the strengths of many. This approach often leads to better accuracy and robustness.
 View Slides
Machine Learning is a type of artificial intelligence. It allows software to learn from data.
 View Slides
Excel is a spreadsheet application for analysis SQL is a language for querying databases
 View Slides
Dirty data leads to inaccurate reports and analysis Ensures consistency across your entire dataset
 View Slides
Practical visual design principles for data professionals to make reports, dashboards, and analytics clear, engaging, and decision-ready.
 View Slides
Start with a raw SQL query Transform data for business logic
 View Slides
Excel: A powerful and flexible spreadsheet tool. Ideal for individual analysis and small datasets.
 View Slides
Two tables need to be joined together But neither has a single unique ID column
 View Slides
Temporary Tables: Created and exist only for your session. CTEs (Common Table Expressions): Defined within a single query.
 View Slides
A computer learns from data It finds patterns and makes decisions
 View Slides
Clean data builds trust in your reports Accurate data leads to better business decisions
 View Slides
Foundation for all Power BI reports and dashboards Directly impacts performance and speed
 View Slides
The application for building reports Where you design and create data models
 View Slides
Prevents data chaos and report confusion Ensures data is trustworthy and reliable
 View Slides
Turn messy, raw data into a clean format Ensure data is accurate and consistent
 View Slides
Others (and future you) need to understand your logic Reduces time spent debugging and fixing errors
Try searching with different keywords or select "All" categories.